
Amsterdam Paralympics
What is the pollution level of the canals and is there data from all the canals?
The challenge when assessing the quality of swimming water lies in the traditional approach of analyzing E-coli and Intestinal Enterococs, which involves a lengthy 48-hour culture period. Consequently, the obtained information reflects the water quality from 48 hours ago, leaving the current quality undisclosed. In contrast, an alternative method involves monitoring sewer overflow. Historical data reveals that there is an immediate decline in water quality that persists for three to five days. Through our experience, we have found that monitoring the physical indicators is the key to accurately determining the present water quality. (Holthuijsen & Ouboter, 2021)
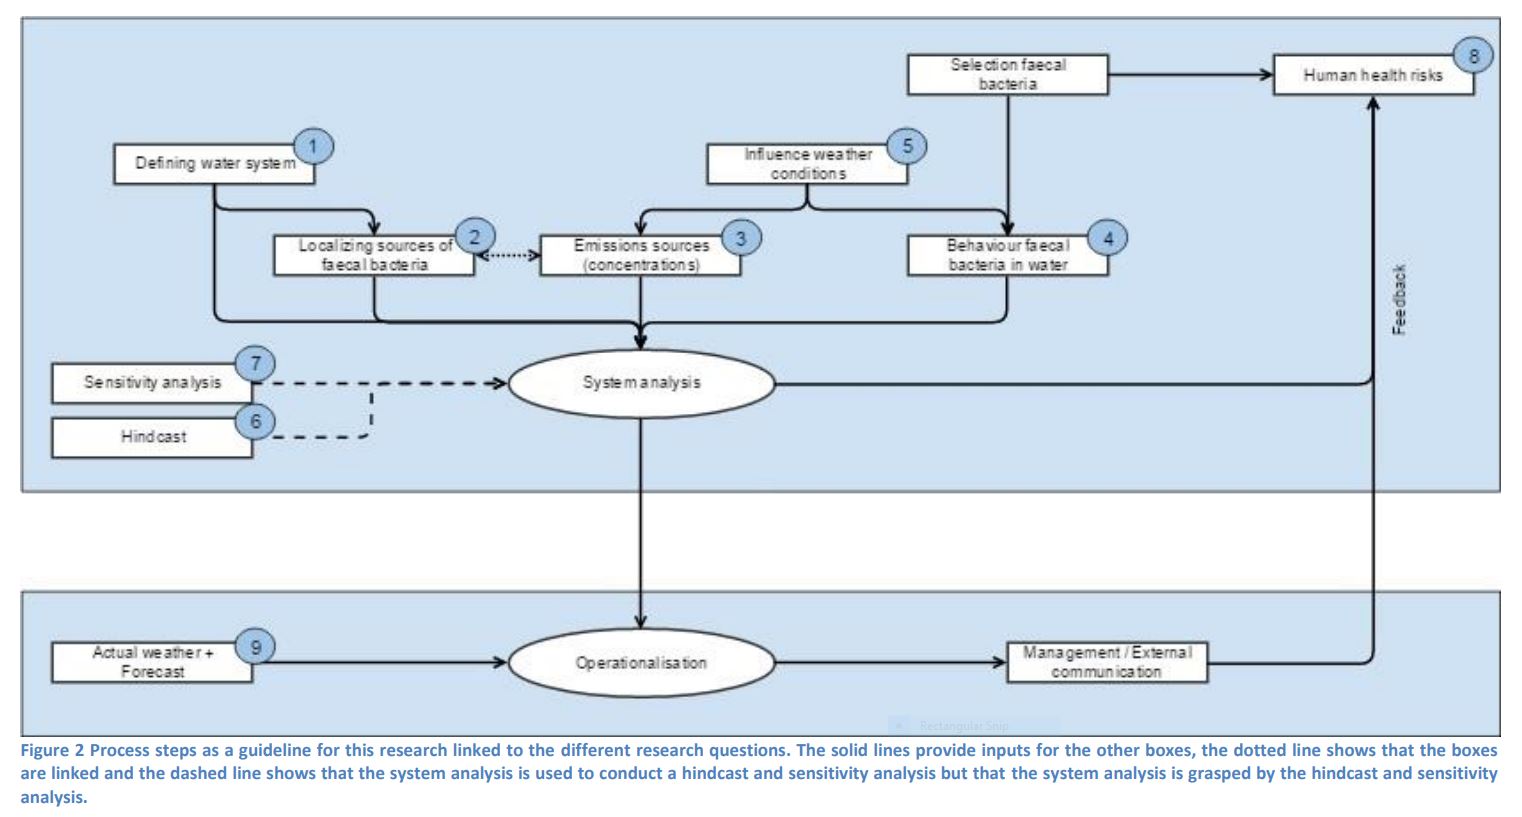 (Figure 1, Guideline for analysis for surface swimming water in Amsterdam Canals. Source: Van Den Tillaart, 2017)
While comprehensive data for all city center canals was not available, specific drainage area points across Amsterdam provided by Waternet offer a glimpse into the overall water quality situation. This data, collected during the summer of 2019, pertains to surface water quality, and represents an average measurement. Since this period aligns with when swimming activities are most prevalent in Amsterdam and corresponds to the Paralympics plans, it holds relevance. However, as mentioned earlier, it is important to note that the only reliable water analysis can occur 48 hours prior to an event and is based on predicting or modeling through factors such as rainfall and monitoring sewage overflow.
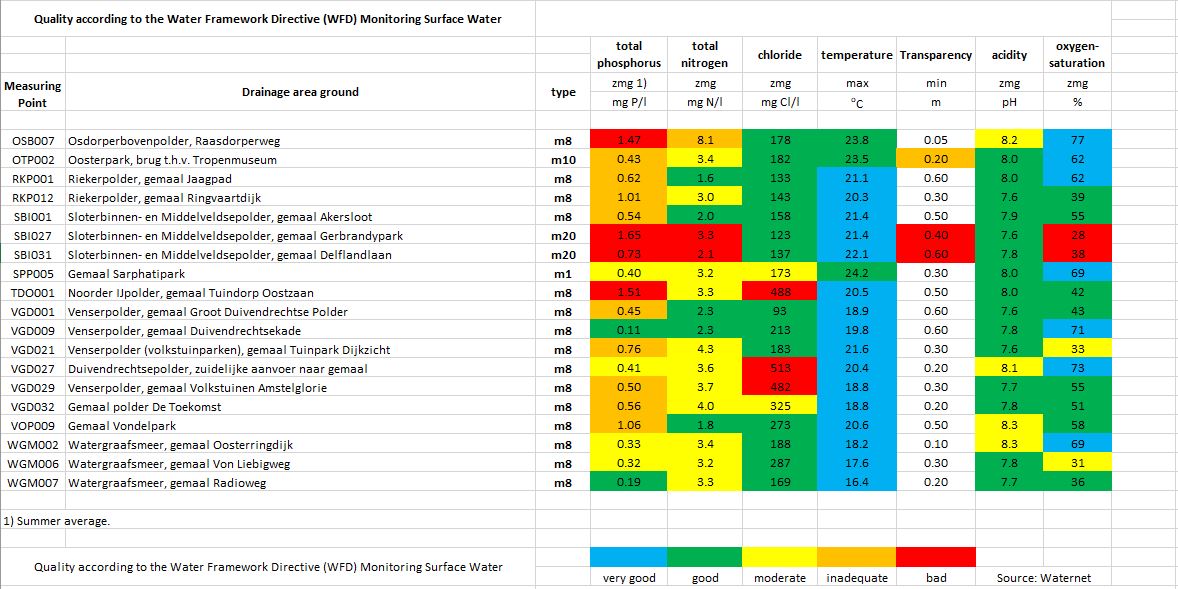 (Figure 2, Quality according to Water Frameworks Directive Monitoring Surface Water. Source: Waternet)
You can swim next to the AMS but the water there is heavily monitored, is this the same for the rest of Amsterdam?
RIVM, the Dutch National Institute for Public Health and the Environment, conducts regular assessments during the bathing season to ensure the quality of the bathing water in designated swimming areas. In the Netherlands, the bathing season typically runs from May 1st to October 1st. However, it is worth noting that, according to the zwemwater.com website, there are currently no designated swimming areas located within the Amsterdam City Center. (Quality of Bathing Water, 2018)
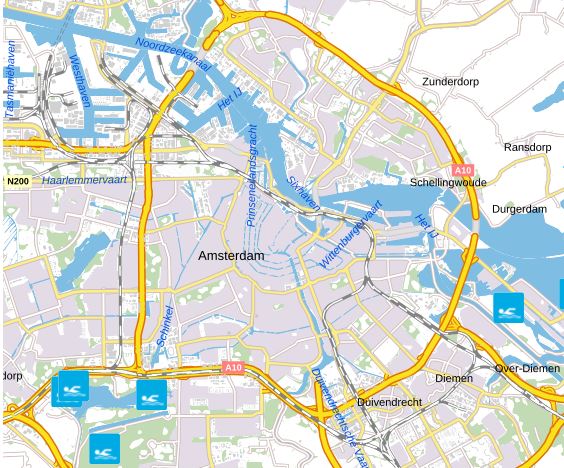
(Figure 3, Designated Swimming locations in Amsterdam Center. Source: Swim)
Currently, Waternet is responsible for conducting measurements related to water quality in the Amsterdam canals. However, since these canals are not officially recognized as European bathing sites, routine monitoring of water quality is not always carried out. Sampling for Escherichia Coli and intestinal enterococcus is conducted once every two weeks during the summer season (mid-April to October) at specific locations. However, at other locations, these measurements are taken only once per summer, and some areas are not tested at all. Additionally, it takes three days to obtain the results using this testing method. This means that the available data always lag behind the actual situation, and there is a possibility of missing instances of poor water quality. Developing a water system model that allows for timely indication of water quality would be a potential solution in this case. Van Den Tillaart, 2017
It is feasible for Amsterdam to organize swimming competitions in the canal district.
Although the canals are not officially declared a source of water for swimming in the Netherlands, the Amsterdam City Swim now takes place every September, with participants raising money for Stitching ALS Nederland (the Dutch ALS foundation). Participants in the Classic Swim (2.1 kilometers) will be taken to Keizersgracht on a special bus. The start of the Classic Swim is at Keizergracht 663, after which the participants will swim together across the canal to the Marineterrein in Amsterdam (Figure 3). Of course, no boats are allowed on this route during the city swim.
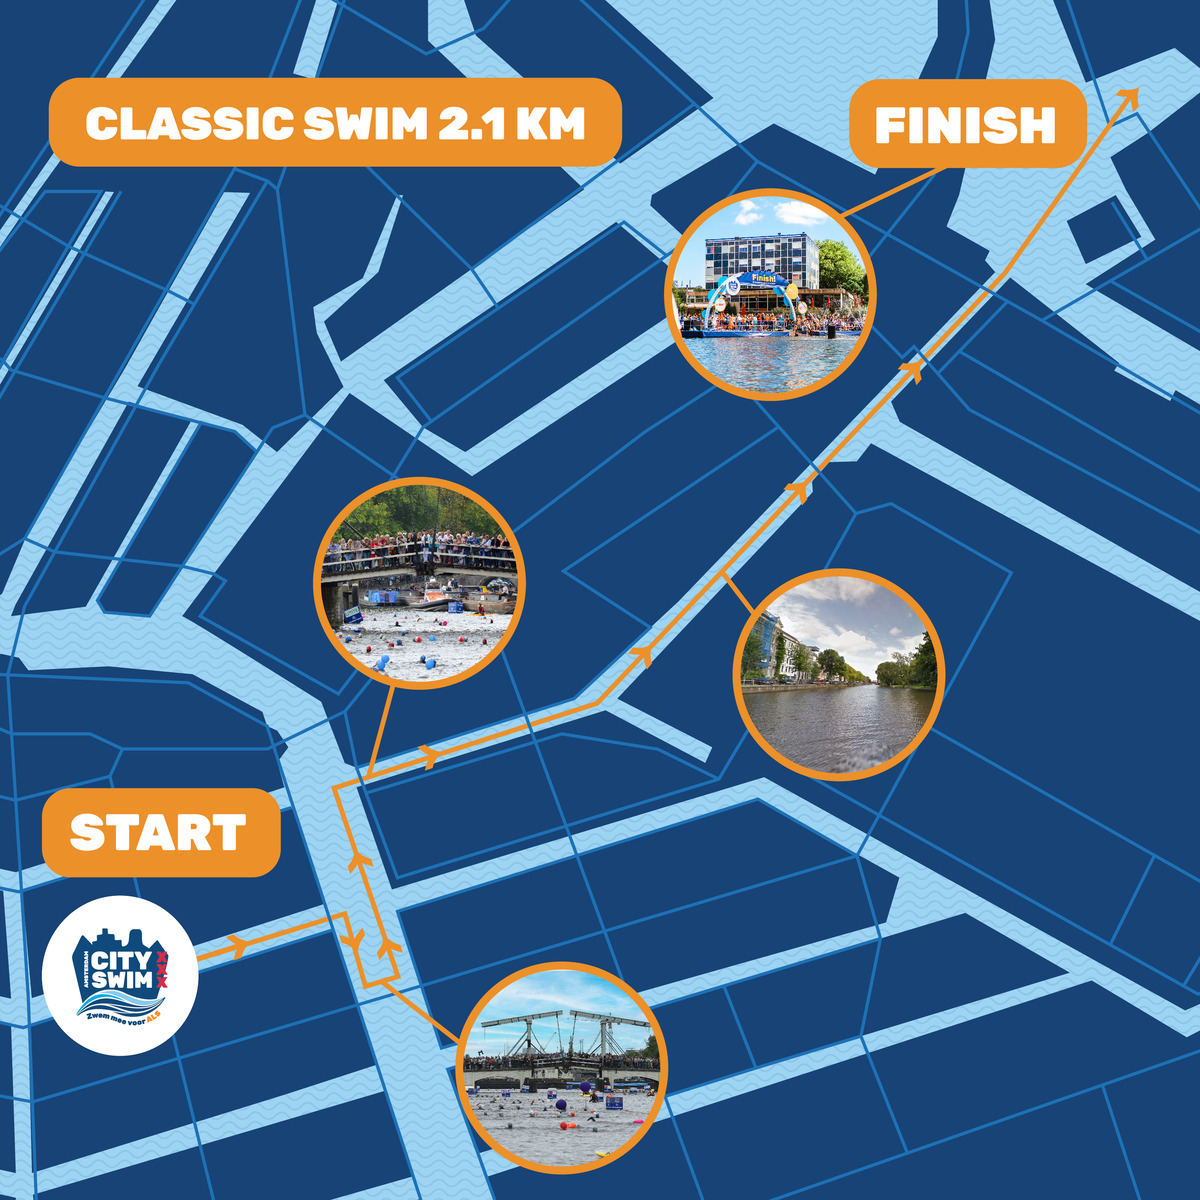 (Figure 4, Source: Amsterdam city swim)
Data sets that are of use for giving proper advice to the municipality:
In addition to the aforementioned datasets, it is crucial to take into account the data catalogue available on the municipality’s open data website data.amsterdam.nl. Specifically, the Water and Risk zones map layers can be utilized to plan a safer route by avoiding hazardous areas, vessel routes, and boat disembarking locations.
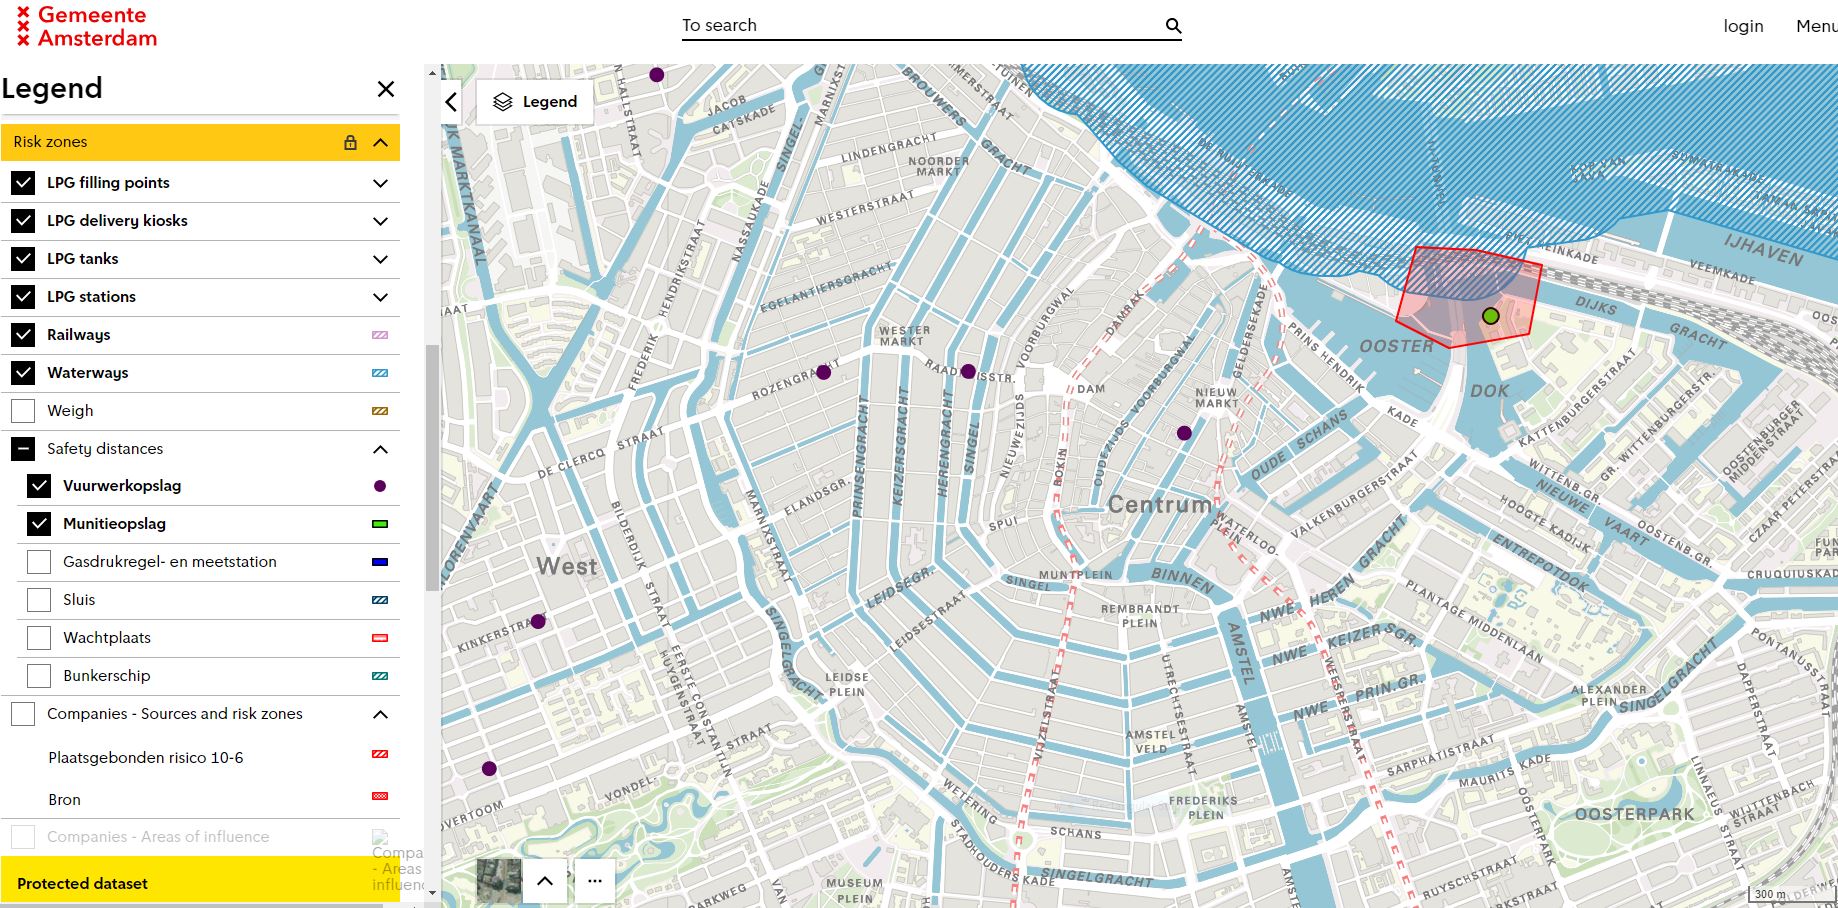 (Figure 5, Risk Zones Layer. Source: Gemeente Amsterdam)
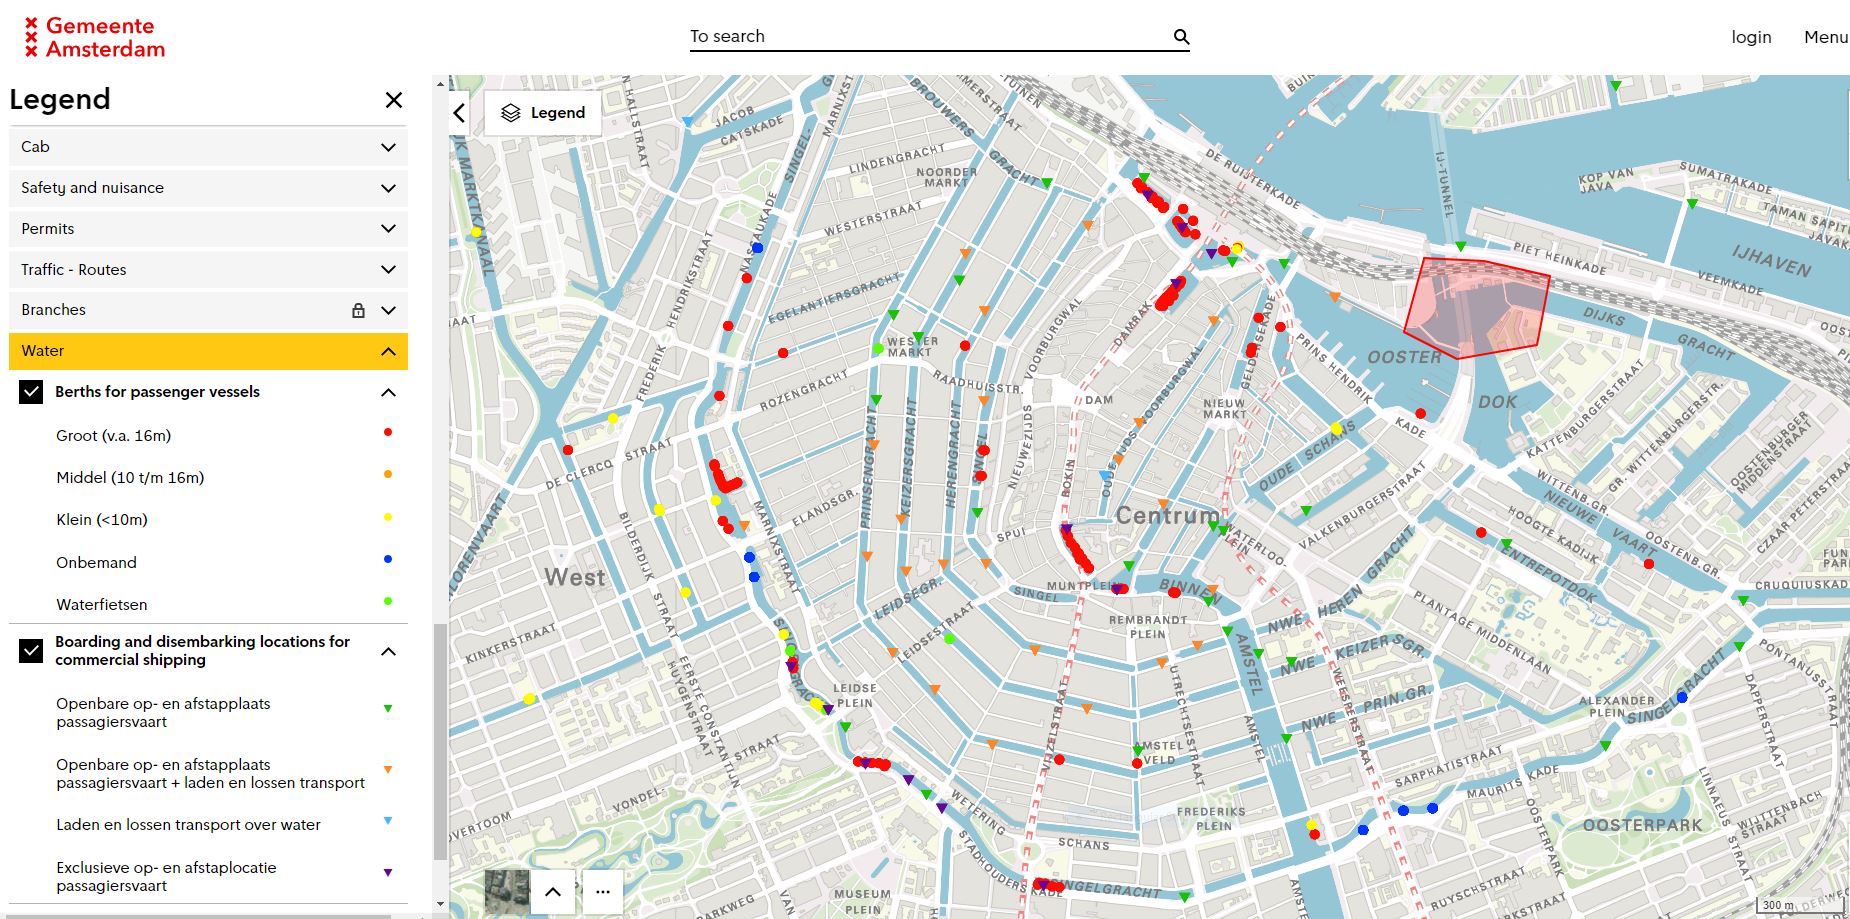 (Figure 6, Water Layer. Source: Gemeente Amsterdam)
In Figure 5 circle markers indicate berths for passenger ships and triangle markers indicate embarkation and disembarkation points for commercial transport. This suggests that if we choose the swim route sensibly, the race will have less impact on commercial water transport and on the route of canal boat trips.
What type of data format is the information?
The data sets used for the assignment are excel files, geo spatial data and csv files. XLSX File Measurement results of surface water quality research, 2019.
If you have geospatial data, can you figure out how the data is geometrically represented (points, lines, surfaces, hyperplanes)?
The geospatial data used is geometrically represented by points lines, surfaces, and polygons in different layers. The key layers used were the water layer and risk layers. The risks layer is mostly composed of geolocated points for specific dangerous locations and a polygon layer for the transport hub encompassed by the Ij river. The Water layer was completely composed of geolocated points for passenger berths, embarking and disembarking points and with point lines for the mayor routes.
In conclusion, assessing the pollution level of the canals in Amsterdam and obtaining comprehensive data for all canals can be challenging. Traditional methods of analyzing E-coli and Intestinal Enterococs have a delay in reflecting the current water quality. Alternative methods, such as monitoring sewer overflow, provide more immediate information, but accurate analysis can only occur 48 hours prior to an event. While specific drainage area points offer insights into the overall water quality situation, routine monitoring of water quality in the canals is not always carried out. The available data may lag behind the actual situation, and there is a possibility of missing instances of poor water quality. Nonetheless, Amsterdam organizes swimming competitions in the canal district, and participants raise funds for charitable causes. To provide proper advice to the municipality, the data catalogue available on the municipality’s open data website data.amsterdam.nl, including the Water and Risk zones map layers, should be considered. The data formats used for the assignment include excel files, geo spatial data, and csv files, while the geospatial data is represented geometrically through points, lines, surfaces, and polygons in different layers.